
Apr 15, 2020
The first National Recreational Fishing Survey innovated new, comprehensive methodology at the time and resulted in establishing best practice for surveys of its kind. This methodology is still the standard used in state-wide surveys where white pages still provide a representative sample.
Methods combined in the 2000-01 survey included telephone, diary and modified creel survey techniques. The survey was a joint initiative of Commonwealth and State governments. This blog sets out to share the main findings…
| With declining landline use in Australia, the white pages is no longer a representative sample of the Australian population. The current survey is again trialling new, innovative methods of population sample recruitment. |
The most notable result to come out of the last National Recreational Fishing Survey, held at the turn of the century, was the recognition of the relevance and size of the recreational fishing “tribe”. The data generated by that survey has been used to push for greater rights for the recreational fishing sector ever since.
Demographic profile of fishers
An estimated 3.36 million Australians, aged 5 years or older, went recreational fishing at least once during the survey period, representing a national recreational fishing participation rate of 19.5%. New South Wales had the highest number of recreational fishers (999,000) followed by Queensland (785,000) and Victoria (550,000). But the highest participation rates in relation to population size were recorded from Northern Territory (31.6%), Tasmania (29.3%) and Western Australia (28.5%) [see fig.1].
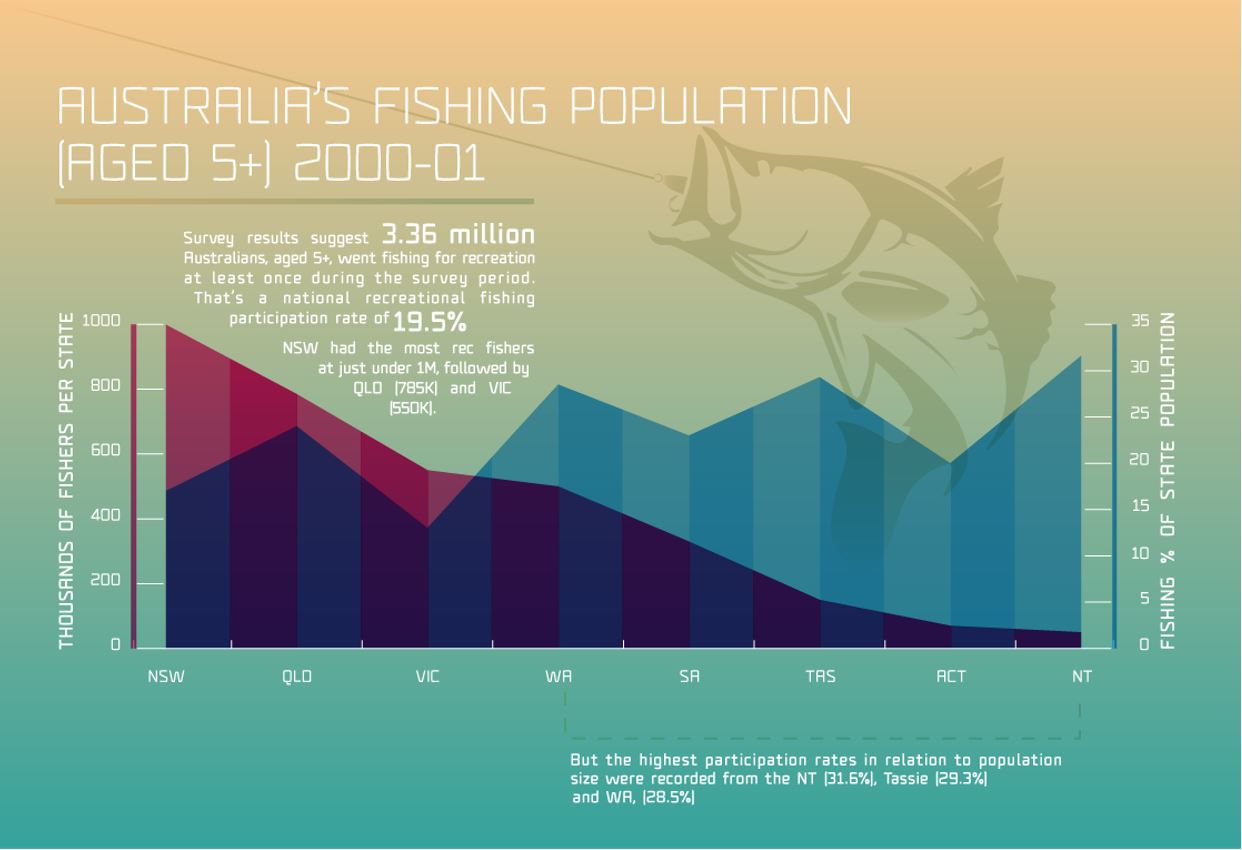
Fig. 1: Number of fishers by state/territory and corresponding fishing participation rates (%) in relation to population size.
Regional participation rates were lowest in urban centres such as Sydney (13.1%) and Melbourne (10.2%), but because of their large populations, urban centres contained large numbers of fishers, often dominating the fisher populations at the State or Territory levels.
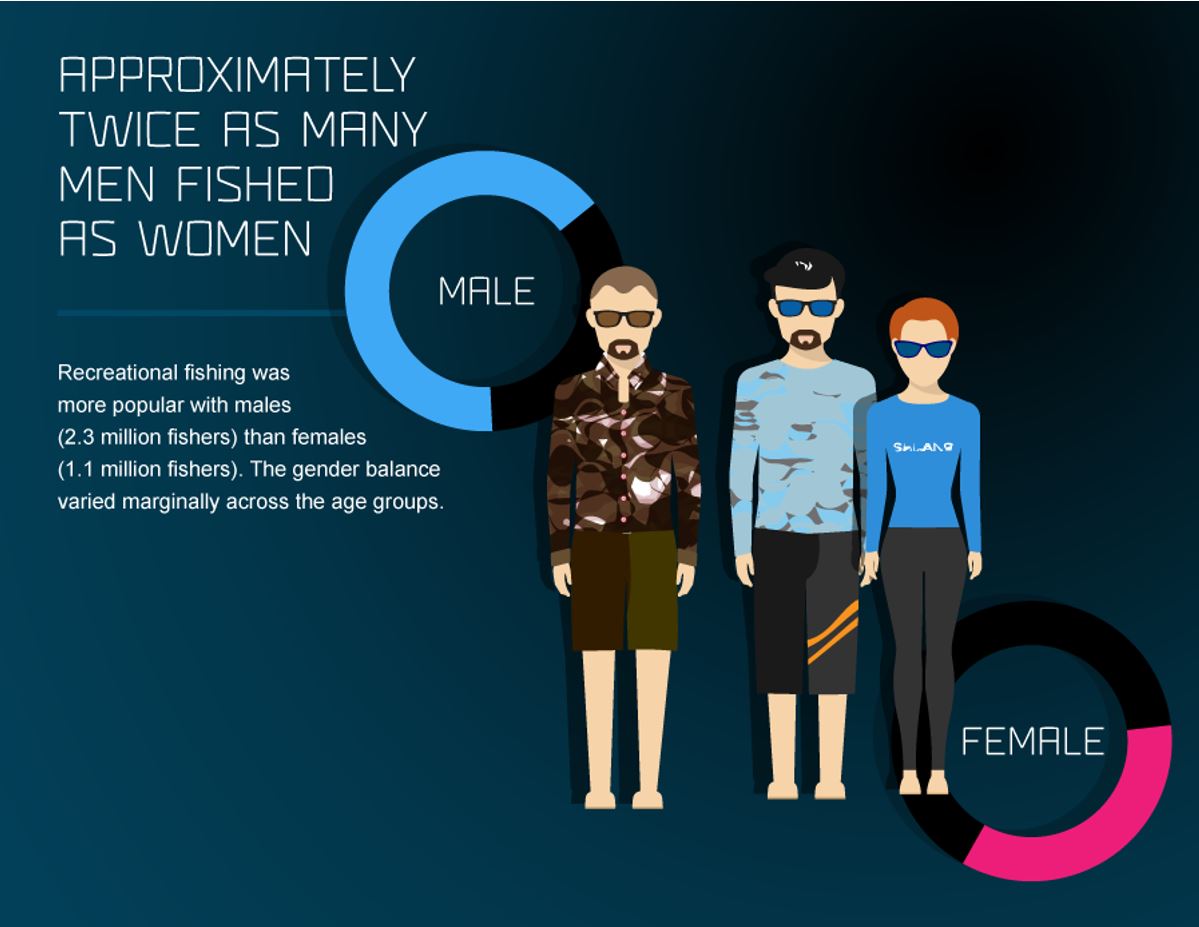
Recreational fishing was more popular with males (2.3 million fishers) than females (1.1 million fishers). The highest number of recreational fishers was in the 30-44 age group (644,000 males and 325,000 females), although participation rates were highest among the 5-14 age group (33% for males and 23% for females, Fig. 2). The lowest participation numbers and participation rate was for those in the 60 to 74 and the 75 and above age classes.

Fig. 2: Proportion of the Australian resident population (aged 5 years or older) who participated in fishing by age and gender.
Fishing expenditure
Recreational fishers in Australia spent an estimated $1.8 billion on fishing related items during the survey year. Expenditure was generally related to the size of the population and the number of fishers. New South Wales had the largest expenditure ($554 million) followed by Victoria ($396 million), and Australian Capital Territory the smallest ($19 million) [Fig. 3a]. The national average attributable expenditure was $552 per fisher per annum, with the highest per capita expenditures in Victoria ($721) and Western Australia ($706) and the lowest in the Australian Capital Territory ($363) [Fig. 3b].

Fig. 3a: Total fishing expenditure for recreational fishers aged 5 years or older.
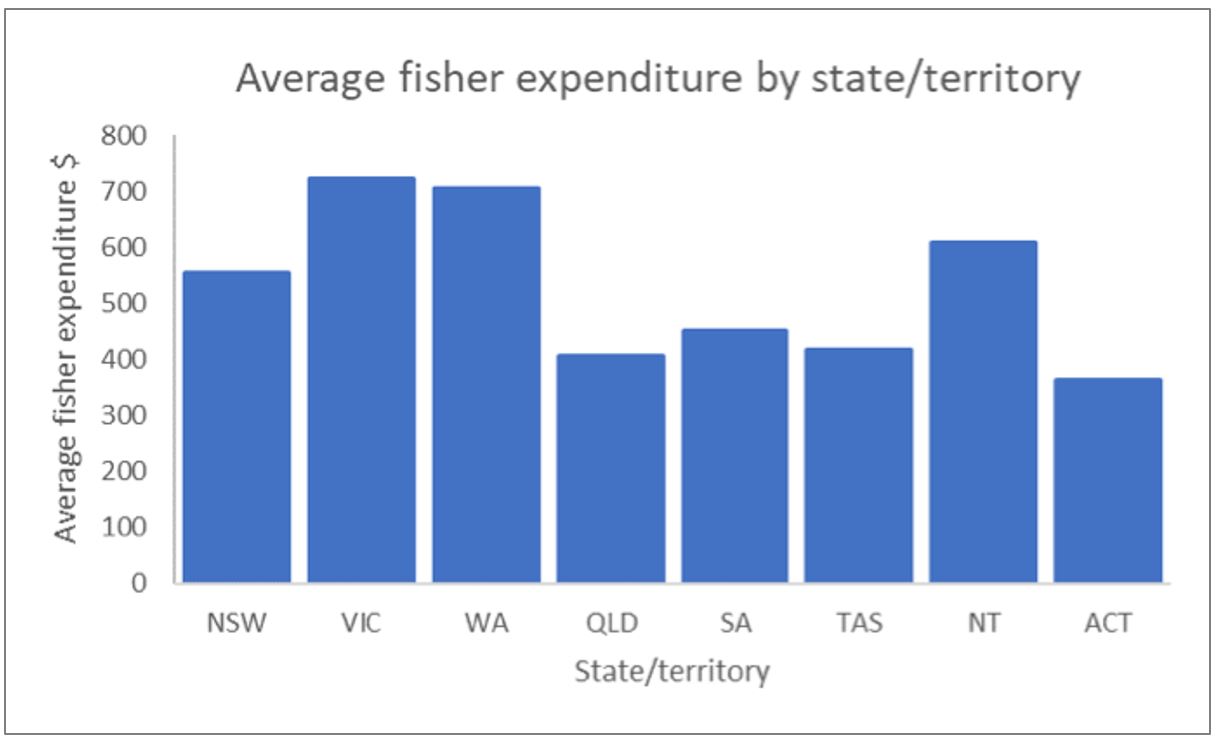
Fig. 3b: average fisher expenditure by State and Territory for recreational fishers aged 5 years or older.
Expenditure on boats and trailers ($872 million) was the largest individual expense for fishers, accounting for half of all expenditure. Travel associated with fishing ($432 million), accommodation ($184 million) and fishing tackle ($146 million) followed in importance [fig. 4]. Residents from capital cities accounted for fifty eight per cent of the estimated attributable expenditure ($1,077 million, although they made up only 50% of recreational fishers. The remaining 50% of fishers expended $778 million.
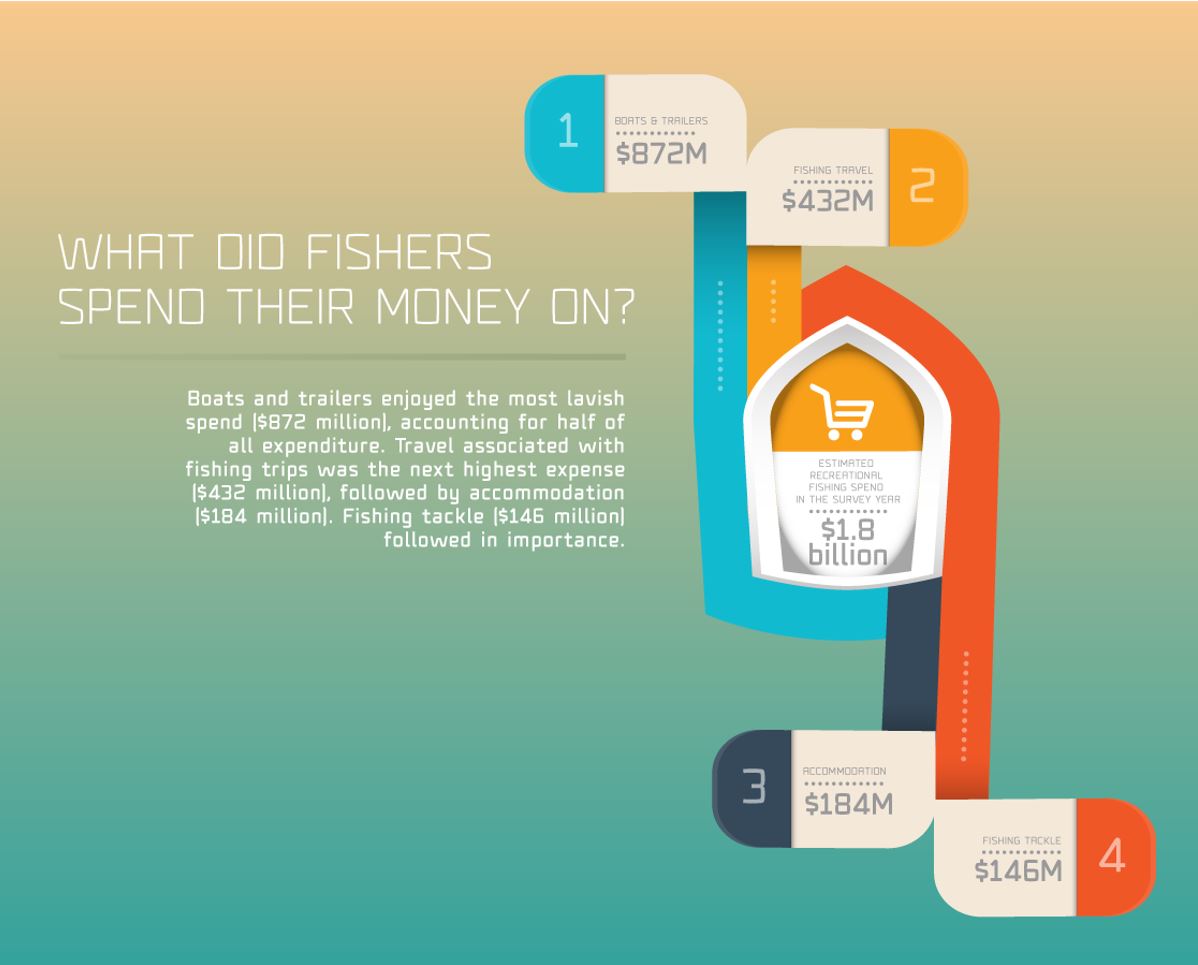
Fig. 4
Recreational fishing effort
Nationally, about 41% of fishing efforts occurred in coastal waters, followed by fishing in estuarine waters (35%), freshwater rivers (11%), freshwater lakes and dams (8%) and offshore waters (4%). New South Wales recorded the greatest effort (30.4 million fisher hours), followed by Queensland (25.4 million fisher hours) and Western Australia (19.7 million fisher hours), and the lowest in the Australian Capital Territory (88.1 thousand fisher hours), [Fig. 5].

Fig. 5: Total fishing effort (fisher hours) by state and territory during the survey period.
Shore-based fishing attracted a greater level of activity (57% of events) than fishing from boats (43% of events). Eighty-five % of the overall annual fishing effort was with line fishing (including the use of bait, artificial lures and jigs as well as set-lines), followed by fishing with pots and traps (7%), harvesting bait with pumps, rakes and spades (4%), fishing with nets (3%) and diving with spears or hand collecting (1%).
Motivation of fishers
The primary motivation for fishing as identified by Australian recreational fishers was ‘to relax and unwind’ (37% of respondents), ‘fishing for sport’ (18%), ‘to be with family’ (15%) and ‘to be outdoors’ (12.5%) [Fig. 6]. Only a small proportion of fishers considered catching fish for food as their primary motivation.
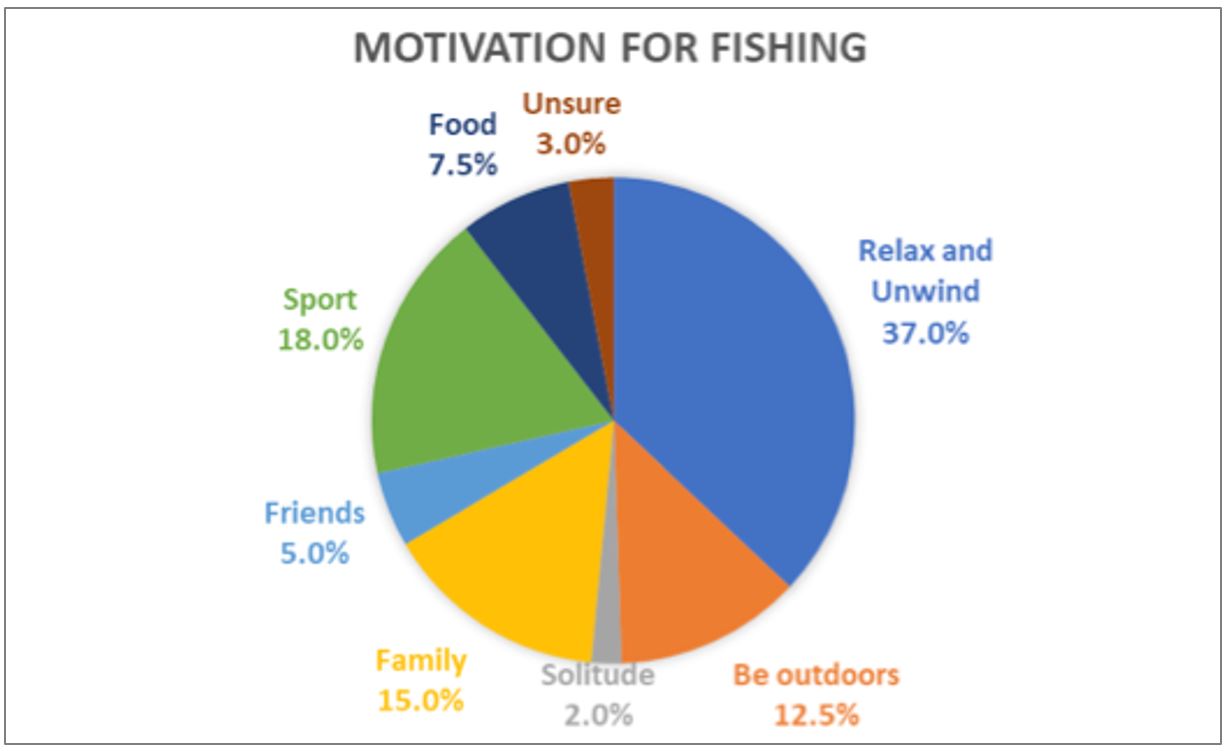
Fig. 6: Primary motivation for recreational fishing as identified by Australian recreational fishers (% respondents).
Indigenous fishers
Indigenous fishers caught more than half their fish in inshore waters. Fifty-three percent of indigenous fishers used lines to fish, 26% hand collected, 12% used nets and 9% used spears [fig. 7]. Indigenous fishers made an estimated 671,000 fishing trips during the survey period.

Fig. 7: Indigenous fishers used various methods to fish.
Tourist visitors
Around 4% of international tourists visiting Australia in 2001 went fishing. Most tourist fishers came from the United Kingdom (24%), Japan (13%), USA (10%) and New Zealand (8%) [Fig. 8]. All age groups were represented by the visitors who fished, though greatest numbers were in the 20-24 and 25-29 age categories.

Fig. 8: Proportion of international tourist visiting Australia during the survey period.
Expenditure by out-of-state residents during the survey year was estimated to be $128 million, or 8% of total attributable expenditure. Attributable expenditure by out-of-state residents was particularly important in the Northern Territory, where it accounted for 30% ($8.7 million), and in Queensland (24%, $78.6 million). However, 60% of attributable expenditure occurred within 40 km of the recreational fisher’s residence ($1,123 million). Forty-eight percent of the fishing expenditure was in marine waters ($897 million), 32% in estuarine areas ($598 million) and only 20% ($360 million) in inland waters.
Use of survey data and importance
The information gathered from this survey is used to measure future trends and development, it is important for supporting the future management of recreational and indigenous fishing in Australia. The full report is available online (https://eprints.utas.edu.au/2526/1/Henry_Lyle_Nationalsurvey.pdf) and to date has been included in over 560 publications and outputs, with the majority being reports (50%) and journal articles (40%) [Fig. 9a]. Since February 2009, there has been over 5,580 downloads of the report and it has received more than 1,800 hits online [Fig. 9b].
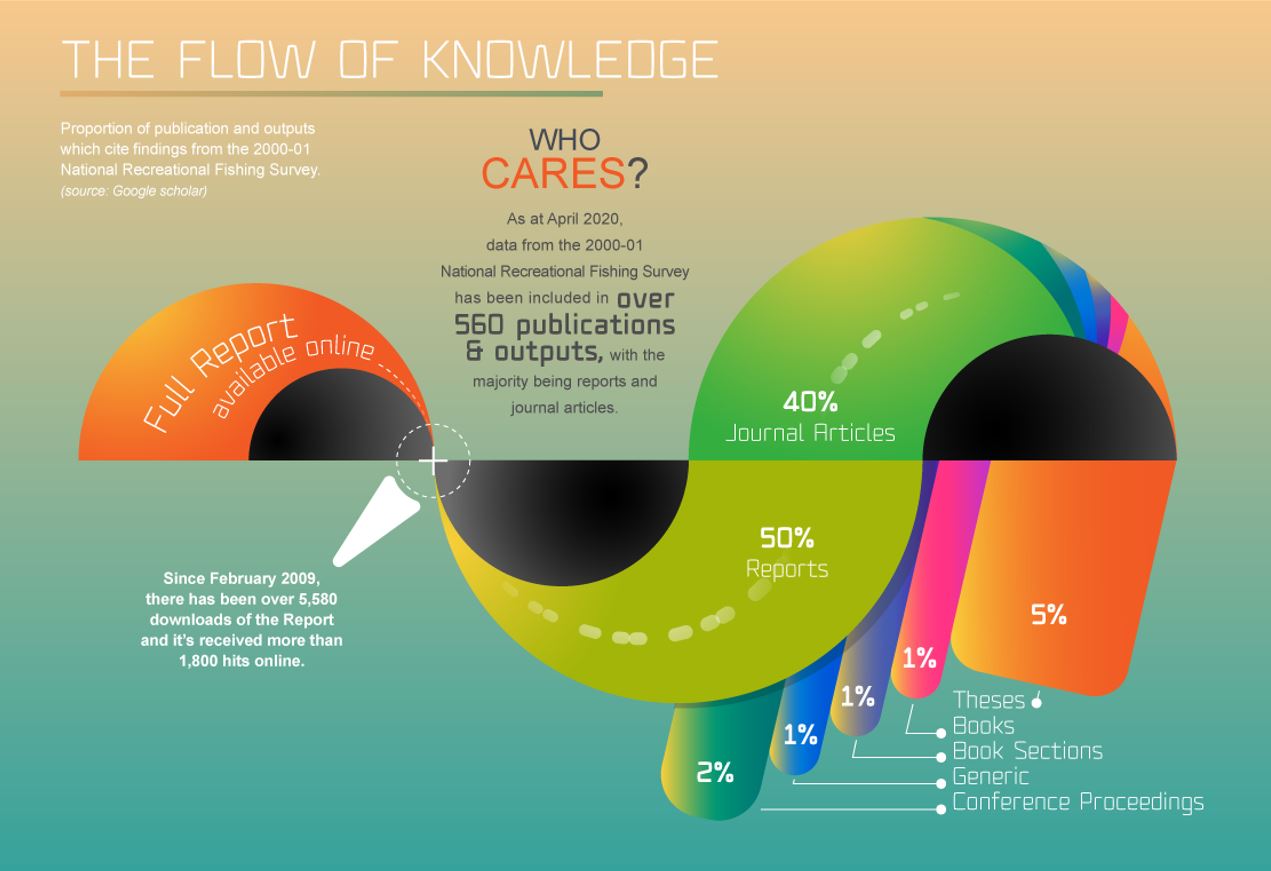
Fig. 9a: Proportion of publication and outputs which cite findings from the 2000-01 national recreational fishing survey (source: Google scholar).
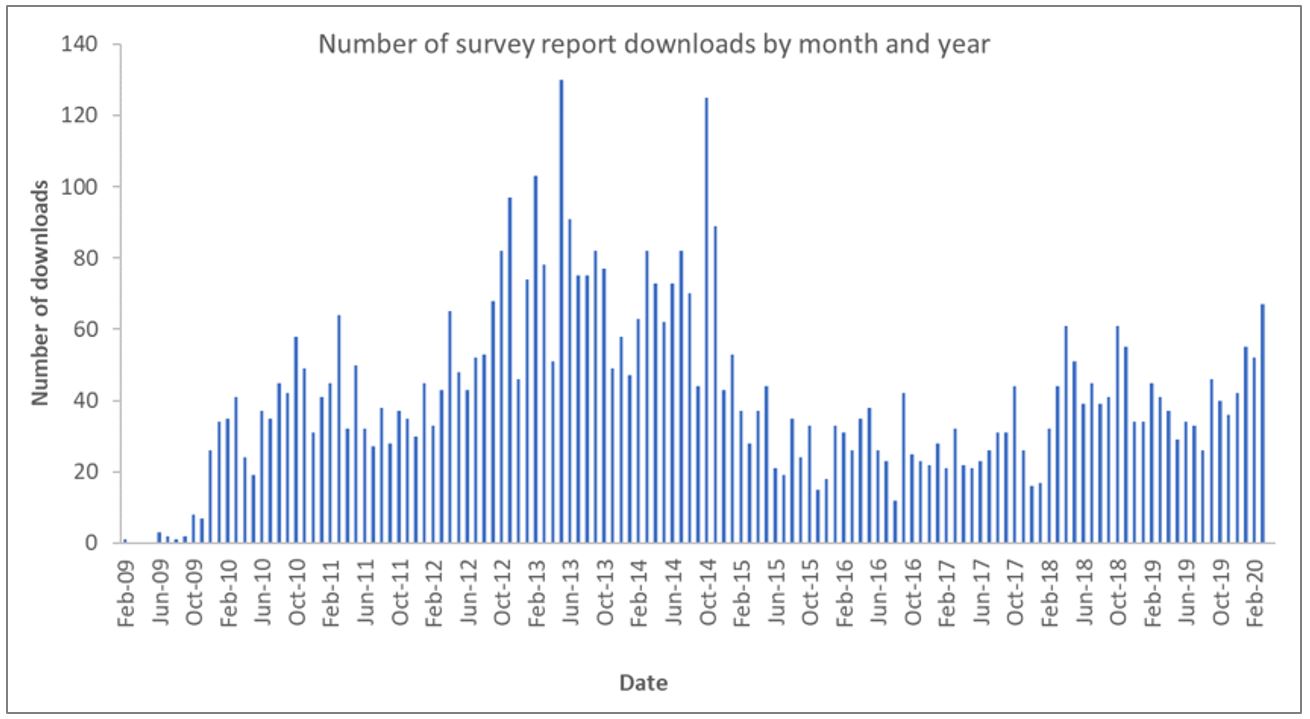
Fig. 9b: Number of downloads of the 2000-01 national recreational fishing survey report by month and year (source: https://eprints.utas.edu.au/cgi/stats/report/eprint/2526).
A Final Thought…
Recognition of recreational fishers as a genuine stakeholder in the aquatic resource came when the economic value of the pastime was established by the Survey. Over the years since, each state has implemented their own policies and procedures to ensure the recreational fishing sector can be supported. In some states, this has resulted in licences that provide a user-pays income stream to fund infrastructure (think FADs, artificial reefs, stocking, cleaning tables, pontoons and fishing platforms, creation of recreational fishing only waters, etc.) and management, creating jobs that previously didn’t exist.
That recognition has also resulted in “seats at the table” of decision-makers, at all levels of government. Where once recreational fishers were regarded as a collection of hobbyists with little importance to the nation, they are now regarded as an important player and a valid stakeholder in Australia’s aquatic resources. This is important, as policy around resource allocation is usually written to ensure best value to the community. To be considered in this equation, recreational fishing and fishers needs to be recognised as a valuable contributor, not a bunch of hobbyists.
| We’re producing lots of nerd writing on this as part of the National Recreational Fishing Survey, which you’ll be able to access. Part of the project involves testing how robust different approaches to recruiting survey participants, sampling, and weighting responses are when we use them to assess recreational fishing. We hope you’ll get as excited by the statistics as we do. |
This study is funded by the Australian government and the Fisheries Research and Development Corporation.