
Apr 2, 2020
Many people ask how you can survey only a relatively small number of people and then say you know something about a whole population, such as all recreational fishers in Australia… or particular types of fishers, like spear fishers or offshore fishers.
How can you be sure?
Surely you need to survey a really big proportion of the population to be able to produce data that can be trusted?
How can you know what number of people need to be surveyed to produce data you can trust?
These are important questions, and there’s a whole field of science dedicated to these issues. Statistical theory says that as long as you get a representative sample of a population, then a sample of around 600 people for social and economic data will typically give you findings that you can be highly confident in – to within around 5 per cent (95% confidence) – no matter what the total size of the population* is.
| * In the world of statistics, the term population refers to the total number of people in a group. |
Whilst it may not seem logical, it generally takes a big increase in sample size beyond that point to achieve even small increases in precision. We’ll explore this in more detail as we go on.
When studying varied populations that are made up of sub-groups, you need to achieve that high level of confidence for every “population” you’re analysing – so, if you’re doing a survey that seeks accurate data on freshwater fishing versus saltwater fishing, you ideally want to make sure you have enough people in each of those categories to have a high level of confidence in the findings. As some people will do both freshwater and saltwater fishing, this doesn’t necessarily mean you need a total sample of 1,200 people (600 from each sub-group). For example, 900 may be sufficient if that includes 300 who only fish in freshwater, 300 who fish in both freshwater and saltwater, and 300 in saltwater only.
In some cases, truly niche populations may not boast 600 – for example, people fishing offshore using jetskis might be a case where achieving a sample of 600 isn’t feasible. . However, when examining broader topics such as expenditure on all types of fishing, or values of fishers, it is often possible to achieve this sort of sample size and confidence level.
Is having a 95% Confidence Rate good enough?
There’s no simple answer to that question, as it depends on what you need to use the data for. If a 5% error rate (i.e. 95% confidence level) means you invest in too few facilities to support fishers in particular locations, you might want more precision. If it’s for broader identification of overall value of fishing, however, it might be fine. The key issue is that it generally takes a large increase in sample size beyond that point to achieve even small increases in precision, meaning we’d need many, many more people to participate to improve the data certainty above 95%.
For example, if we were able to increase that representative sample from 600 to 4,000, we can only expect to be 98% confident the results are correct.
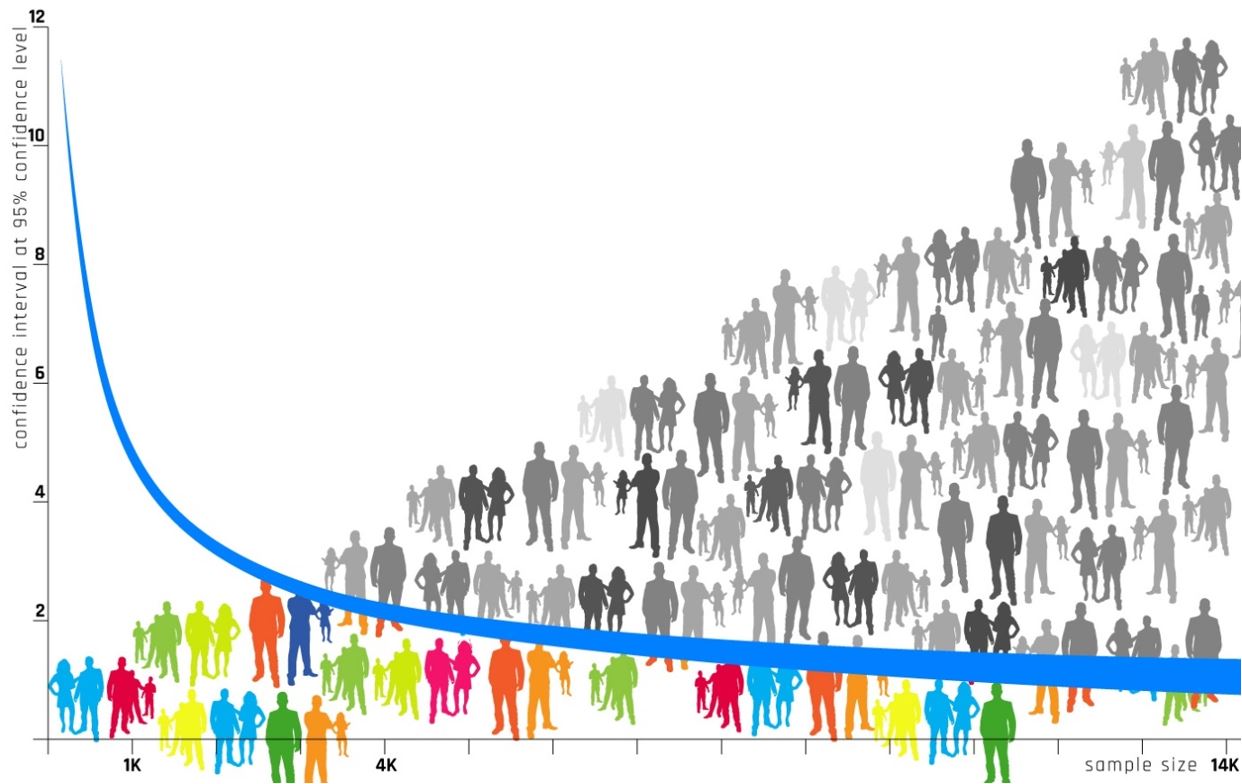
To get to 99% confidence, we’d have to increase the sample to more like 14,000 – so as sample sizes increase, there are diminishing returns in terms of accuracy and insight.
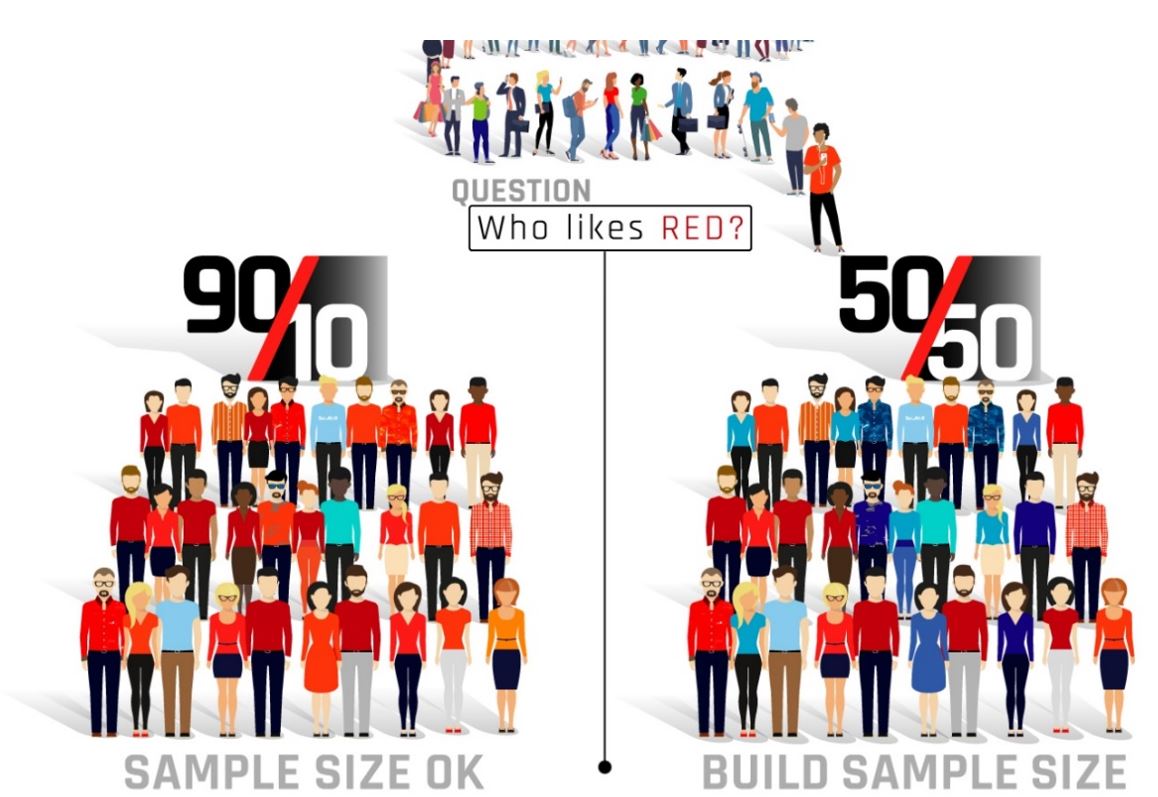
A really good website for statistics nerds who want to read up more on this is https://www.surveysystem.com/sscalc.htm. It lets you test out how confident you can be in results from different samples, but also explains how that confidence changes depending on people’s answers to a question (error is ‘proportional to sample variance’, in the world of statisticians). If 50% of people answer “yes” to a question, for example, and 50% answer ”no”, you need a bigger sample to be confident that the results are representative of the population. If 99% answer “yes”, however, and 1% “no”, you can have high confidence in a smaller sample.
A bigger issue than sample size, though, is making sure your sample can be analysed in a way that is truly representative of the population. The last two decades have seen steep declines in typical response rates to surveys, which increases the likelihood that the responses received are biased to particular groups (for example, older people are more likely to complete any kind of survey than younger people). This is the case for pretty much any survey method. To address this, researchers are using two methods: one is quota sampling, where the survey keeps going until the required sample from an identified group in the population (think gender, age group, region, or fisher type) is achieved.
This makes sure there’s enough people sampled in every group you’re interested in to ensure a robust sample that can be successfully analysed.
The other method – often used in conjunction with quota sampling – is weighting of survey responses. This is used by organisations such as the Australian Bureau of Statistics to correct for known biases in responses and ensure the results produced are actually representative of the population.
| We’re producing lots of nerd writing on this as part of the National Recreational Fishing Survey, which you’ll be able to access. Part of the project involves testing how robust different approaches to recruiting survey participants, sampling, and weighting responses are when we use them to assess recreational fishing. We hope you’ll get as excited by the statistics as we do. |
This study is funded by the Australian government and the Fisheries Research and Development Corporation.