
Australia and New Zealand’s abalone industries have distinct cultural and operational differences, but a shared need for better information is bringing closer collaboration
 Abalone diver, Tasmania.
 Photo: Stuart Gibson
By Catherine Norwood
Divers, data loggers and the divergent approaches to data management were among leading topics of conversation at the first joint Australian–New Zealand abalone industry
convention this year.
The convention was held in Queenstown, New Zealand, and attracted more than 150 participants – researchers, managers and fishers – to hear the latest research and marketing developments for the industry. It was a joint initiative of the Australian Abalone Council and the New Zealand Paua Industry Council and sponsored by the FRDC.
One of the major benefits to come from the event was the recognition of the shared needs of the industries in both countries, says Australian researcher Craig Mundy, who has been collaborating with New Zealand for almost a decade.
The two countries have already worked together on several projects, but Australia’s FRDC and the New Zealand Ministry for Primary Industries indicated at the convention that they would move to formalise shared research priorities.
Chief among these is the need for better information in assessing the state of the abalone resource (or paua, as it is known in New Zealand). Populations can be highly variable in productivity, even within a space of a few hundred metres, depending on exposure to different water and weather conditions.
Based at the Institute for Marine and Antarctic Studies (IMAS) in Tasmania, Craig Mundy has been working in this field for more than 10 years, developing new data-logging systems to improve information gathering and subsequent decision-making.
This has involved creating or adapting everything from the equipment to the programming and data analysis to suit the needs of the abalone fishery.
For most of these 10 years he has also worked closely with the New Zealand industry, which was quick to see the potential of the data-logging approach and has adapted the Australian work to fit its own particular industry operations.
Proof of concept
Craig Mundy’s first major abalone data project, funded by the FRDC, involved abalone industry groups in Tasmania, Victoria, New South Wales, South Australia and Western Australia. It successfully provided a ‘proof of concept’ for the data-logging equipment and analytical methods to utilise the spatial data.
The equipment consists of a boat-based data logger and depth logger for each diver. The boat units use the same GPS technology as mobile phones, combined with a mini computer.
They record time, date and location. As the divers are connected to the boats by a surface supply hooker line (they are never more than 30 metres from the boat), diver units only track depth and water temperature. This information is transferred to the boat units when divers surface.
“In the first project we focused on how to manage the data; in Tasmania alone we generate about eight million records a year from 24,000 dives,” Craig Mundy says. “We also needed to work out how to turn that information into performance measures for the fishery, so that we weren’t just making maps of where people were diving.”
One of the indicators to emerge from the amalgamated data was the frequency of short dives (10 to 15 minutes). He says 15 minutes is generally the point at which a diver decides whether to leave a site, or whether there appears to be enough abalone to make it worth staying.
“If the proportion of 15-minute dives is increasing in a particular area, it indicates the resource is in decline in that area. If the number of short dives is steady, or decreasing, it suggests the resource is stable or improving,” he says.
Performance measures
Craig Mundy’s follow-up four-year project, also funded through the FRDC, involves Tasmania, western Victoria and NSW. The project is formally incorporating data logging into abalone fisheries management, and Tasmania is leading the way. This project began in 2012 when Tasmania introduced mandatory data logging for all of its 121 licensed abalone divers.
Craig Mundy says government and industry agreed that the information collected was valuable, but to make it worthwhile everyone had to be involved. A similar philosophy underpins the strong Victorian and NSW industry engagement with this new approach.
The project has funded the staff and operational costs of data logging and analysis, with each state providing the data-logging equipment for its operators.Every three months, the memory cards in the boat units are exchanged for new ones and the collected data is sent to Craig Mundy.
While the individual information remains confidential, the amalgamated information is used to identify trends and develop performance indicators.
The data loggers do not collect information on catch. This is still submitted separately by fishers as a total for the day, along with time spent diving. These catch-and-effort records can later be cross-referenced with information from the data loggers.
The statutory catch forms only record information per catch ‘block’, which might be a 40-kilometre or more stretch of coast. The data loggers operate on a scale of 20 to 30 metres.
“At the moment, only two pieces of evidence are used in the abalone resource assessment: catch and catch per unit of effort (CPUE). There are a lot of variables that can affect how long it takes a diver to get their catch other than abundance, which in turn affects the CPUE.
“If I can expand that to five or six pieces of information, then it gives us more certainty that the fishery is heading in a particular direction and we can more closely validate what divers are experiencing.”
Short dive pattern

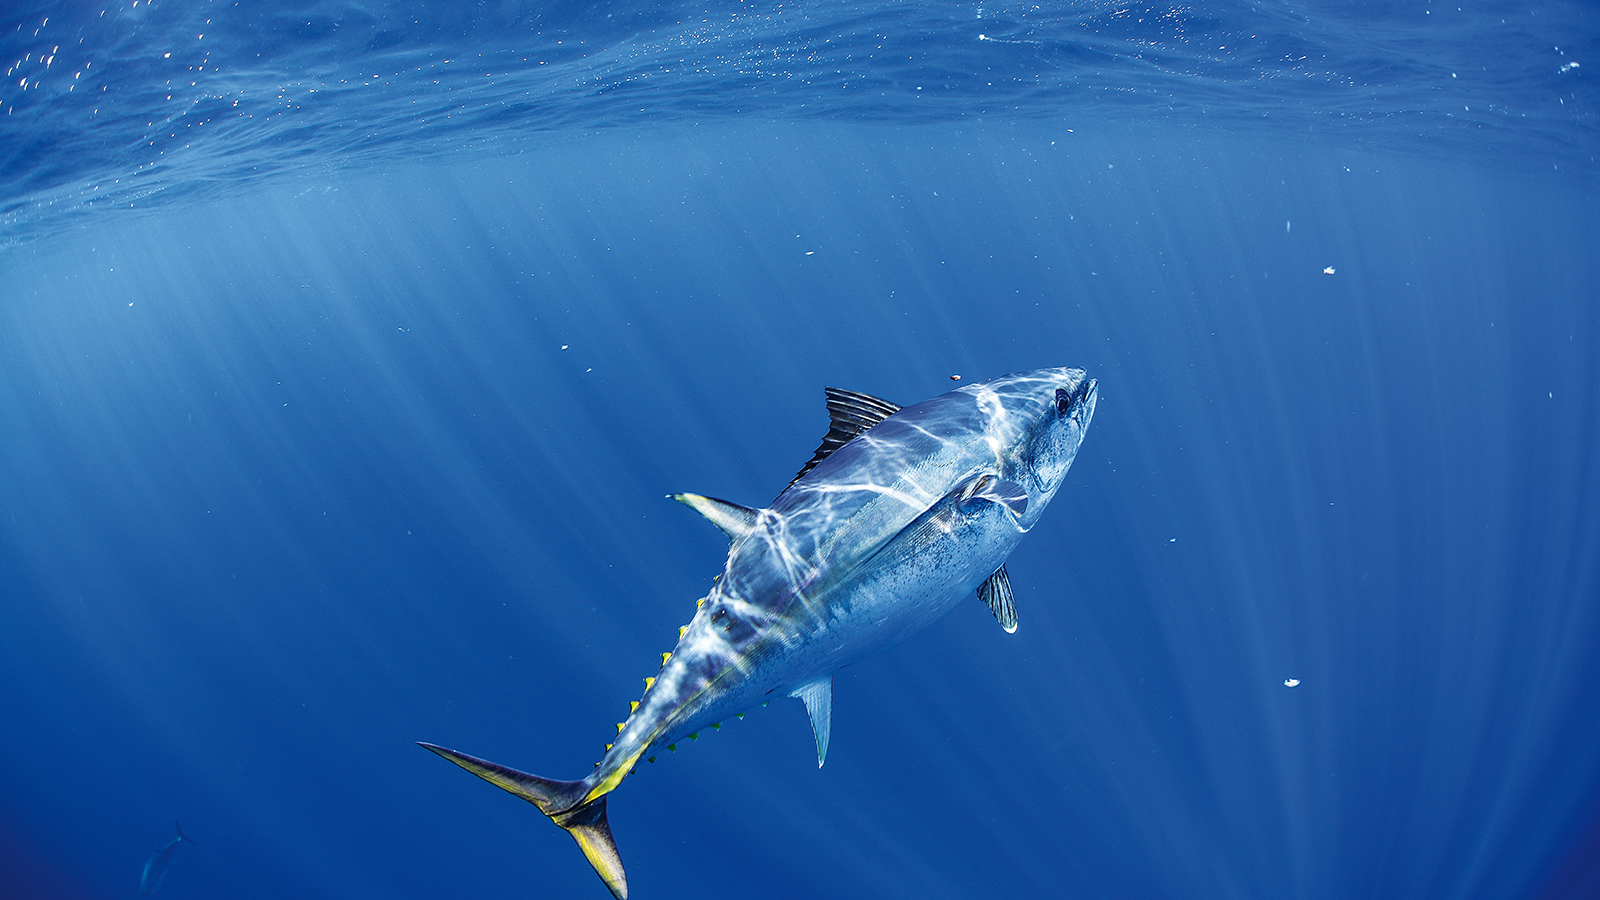
 (Top) New Zealand operates a breath-held fishery, with divers using only snorkels and lung capacity to hunt for their catch. (Bottom) Paua in a rock pool.
 Photo: Jeremy Cooper
Craig Mundy says on the east coast of Tasmania the catch rates have been falling in recent years and there has been some concern about the state of the fishery, but it now seems to be turning around.
The proportion of 15-minute dives can be used as an indicator of the abalone being in decline and there were fewer 15-minute dives recorded in 2012 and 2013.
“That’s what we would expect with a fishery in recovery,” he says.
“On the west coast, where catch rates have been falling for several years and we have started to take some reductions in the total allowable commercial catch, the number of 15-minute dives is increasing.”
However, divers have also indicated that catch rates were not reflecting the decline they were seeing in the resource. “They might get in the water and catch 100 kilograms in an hour, but the following year they might need to travel twice as far during the dive to do that.”
He is working to analyse the distance divers travel from the data, but is also working on loggers to record the rate of catch, without asking the boat operators to stop and record weights for
each bag harvested.
“In the past we have put a depth logger on the weighted line that is used to drop new bags to divers and is exchanged for the full bag of abalone. From this we know the precise location of the diver, because we know where the bag goes into the water. And the faster the bags are exchanged, the higher the level of catch in that area.”
However, the technical challenge has been to develop a logger that can withstand the impact of hitting rock each time the bag is dropped. While divers liked the catch information the process provided, hardware failure was a constant issue.
New Zealand initiative
Craig Mundy’s research also sparked the interest of the New Zealand industry, led by the executive officer of the Paua Industry Council of New Zealand, Jeremy Cooper. The two worked closely together although the distinct operational differences in New Zealand have resulted in a different approach to data logging.
While Australia’s fishery is based on one or two divers operating from a boat-based hooker supply line, New Zealand paua is a breath-held fishery and divers are often some distance
from their boat.
“You could have four divers operating from one boat,” Jeremy Cooper says. “They’re dropped along the coast, and the boat waits up the end, and everyone sort of leapfrogs each other up towards the boat.
“We needed different information and a different system to the Australian one, and we wanted something that was fully automated and as real-time as possible.”
Their boat unit is similar to the Australian one, but can record data for up to four divers. It connects with the turtle units that the divers wear on their backs. These record depth and duration of dive as well as recording GPS coordinates each time a diver comes to the surface.
When divers return to the boat, the boat operator pushes a button on the boat unit to record the catch for each diver and the location of the catch. One unit effectively captures catch, the other captures effort. At the end of each day, the information is uploaded to a cloud-based database.
Working in conjunction with the New Zealand crayfish industry, the paua industry has also developed a satellite modem with the aim of uploading the day’s information, either via satellite or mobile phone technology, directly from the boats. Jeremy Cooper says this system should be operational next year.
Use of the data loggers in New Zealand began five years ago on a voluntary basis and all data is owned by the industry, which also buys the equipment itself. The boat units cost about NZ$1400 (A$1245) and diver units are NZ$700 to NZ$800 (A$620 to A$710). The satellite modem is expected to add NZ$750 (A$665) to the cost of the boat unit.
Information is stored on a cloud-based web server accessed by password. Individual operators can review their catch and dives from their data each day. (Craig Mundy hopes a similar system will be available in Australia within the next two years.) The New Zealand system also allows divers to share their information, to improve fishing efficiency.
Business case
About 80 per cent of New Zealand divers are already using the data loggers and in the 2014-15 season some larger quota holders are making it compulsory for all of their divers to use data loggers. It is about business efficiency: it simply does not make sense to have divers visit an area that has recently been harvested, or which is known to be in decline.
Jeremy Cooper says one of the major benefits for the industry will be reducing the need for full-blown stock assessments, which cost up to $300,000. “Eventually, we can see our data will be used in the stock assessment process, which we hope will reduce the cost of assessments to a third of what it used to be.”
The information from an individual dive is aggregated to per hectare level, then to a reef, then to the larger statistical areas and up to quota management areas.
Divers still complete statutory forms for catch and effort at the end of each day, which can take up to three months to be processed. They are then made publicly available at the amalgamated statistical level.
“Once we get the complete system up and running, that level of reporting would be available next day. It would indicate where the best catches are coming from and help fishers to identify where to go tomorrow; it’s a harvesting tool,” Jeremy Cooper says.
“Because we own the data, we have our own internal reporting and we can already start comparing the productivity of individual reefs this year with last year. We hope to be able to set key performance criteria and put in place harvest limits on certain reefs, and when that limit is reached a ‘bell’ will ring.”
He says the industry is working closely with the New Zealand Ministry for Primary Industries to allow for the fully digital transfer of catch-and-effort data for statutory reporting, catch sampling data and stock assessments. With the satellite modems, the data loggers could also provide a vessel monitory system capacity, showing where every vessel is and how much each has caught up to that point.
Abundance in Fighting Bay
For Jeremy Cooper, the ultimate outcome of data loggers is to automatically generate an index of abundance to support the sustainable management of the industry. Being able to zero in on a specific reef and review the index of abundance for that area could better guide fishing effort.
“If the index is going up in a certain location, it suggests there are more paua there; if it’s going down, it suggests there are fewer to harvest,” he says.
However, generating a “robust” index of abundance for the paua is not a simple issue. “It’s easy in the crayfish industry, because all the lobster pots are the same size and are deployed in the same way.
In the paua industry, you can’t just use kilograms per diver per hour because it’s not robust enough. There are too many variables that can mask the real abundance – dive depth, visibility, wave conditions, even how fit the diver is.”
However, a small-scale stock assessment at Fighting Bay, on the north-eastern tip of New Zealand’s South Island, has provided an important first step in setting a baseline for an index of abundance. The bay has been closed to harvesting for 16 years, so the project has provided an indication of the ‘unfished’ state of the Marlborough region abalone reefs.
From an 18-kilometre stretch of coastline, an area 400 metres long by 10 metres deep and 10 metres wide was fished. Over the course of five days, four divers harvested 8.5 tonnes of abalone. The longer they fished, the fewer abalone they harvested, until every abalone of legal size had been collected.
“It is all mapped with the data loggers,” Jeremy Cooper says. “Every dive made, every catch landed, every time divers crossed the reef.”
The results have revealed a direct relationship between the rate of depletion and abundance, a finding that has excited CSIRO senior scientist Malcolm Haddon, who specialises in resource assessment and fisheries modelling.
Malcolm Haddon was also involved in the early development of the spatial data logging approach in Tasmania. He says it is important to have a clear understanding of the assumptions used in resource assessment, and often “an allowance” is made for variables, so that the catch rate is not a direct reflection of abundance.
“What Fighting Bay shows is that maybe we should not make that kind of adjustment,” he says.
Jeremy Cooper says New Zealand wants to further test this assumption, which could allow information from the diver data loggers to be used entirely as the basis for stock assessments.
“We want to be able to generate a number that indicates whether our fishery is looking better or worse on this side of the reef, or that side of the reef, compared with the same time last year.”
FRDC Research Codes: 2011-201, 2013-240
More information
Craig Mundy, 03 6227 7232
craig.mundy@utas.edu.au
Jeremy Cooper, +64 (0) 2 7432 3041
cooper@xtra.co.nz