
The development of the first carbon footprint of Australia’s seafood industry could give our product a competitive edge when it comes to consumer preferences for low-emission proteins
By Annabel Boyer


Rob Bell Photo: Blueshift Consulting
A recent FRDC-funded study has lifted the lid on the energy use and greenhouse gases emitted by Australia’s seafood industry, resulting in the first ever mapping of its carbon footprint.
The project has been carried out by specialist blue economy consultancy Blueshift Consulting. Principal Investigator Rob Bell says the information is a vital step in providing a competitive advantage for seafood as a low-emissions protein. It also highlighs how seafood production may need to adapt in the future.
“As we get more and more information about the impacts of climate change, consumers are going to want to know about the carbon footprints,” he says.
“To remain competitive and to highlight the comparative benefits of eating seafood compared to other proteins, it behoves the industry to start measuring and managing these emissions profiles. Seafood comes out, typically, pretty well compared to other proteins, but there is always room for improvement,” he adds.
Unique characteristics
Until now, emissions from fishing and aquaculture have been included within the agriculture and forestry sector, as part of the total emissions reported in the Australian National Greenhouse Accounts.
But on closer inspection, Rob says there were some issues. “Fishing and aquaculture were a relatively tiny little blip that got buried in all of the other information.
“Instead of being directly measured and calculated, it was calculated by proxy mechanisms, allocated percentages of total emissions like percentages of total fuels, consumed directly or indirectly.”
But this use of proxy calculations was problematic because of the unique characteristics of fishing and aquaculture.
In land-based food production, large amounts of emissions occur through land use and modifications. There are fewer of these emissions in fishing and aquaculture.
Table 1: Greenhouse gas emissions from Australian fisheries and aquaculture (CO2-e)*
|
Fishery/species |
Total emissions (CO2-e) |
Kg CO2-e |
|
Sardines |
68,066 |
1.6 |
|
Other finfish |
280,260 |
4.5 |
|
Oysters |
42,248 |
5.1 |
|
Sharks and rays |
27,671 |
5.5 |
|
Scallops |
41,741 |
6.3 |
|
Prawns |
117,749 |
6.7 |
|
Salmonids |
561,128 |
8.5 |
|
Rock lobsters |
89,851 |
11.2 |
|
Barramundi |
46,265 |
13.5 |
|
Prawns |
102,515 |
15.2 |
|
Tuna – farmed |
149,459 |
17.9 |
|
Total: |
Average: |
* CO2-e = Greenhouse gas emissions as carbon dioxide equivalent number. Source: Blueshift Consulting
Complex calculations
Measuring the carbon footprint of a sector is a complicated task that requires an account of all of the emissions generated directly and indirectly. This includes everything from fuel burnt directly to power fishing vessels, to purchased electricity, refrigeration emissions and the emissions from services and products bought from external suppliers such as bait and aquaculture feed. This last category is the most difficult to calculate as it requires information from third parties.
Rob says getting information from suppliers can be a significant challenge. “In the case of aquaculture, the embodied emissions in feeds are a major contributor. But it is hard to get a handle on. Many aquaculture companies are making progress, but they are still grappling with this.”

Carbon footprint discussions often centre on carbon emissions, but different activities produce different types of greenhouse gases (GHG). Methane released from aquaculture ponds and cages is an example of this. These emissions are recorded using a carbon dioxide equivalent number (CO2-e), which indicates their warming impact relative to carbon dioxide. As an example, methane has a global warming potential 25 times that of carbon dioxide. One kilogram of methane emissions has a GHG equivalence of 25 kilograms CO2-e.
Sector emissions
The study measured the carbon emissions and energy use from the largest sectors within fishing and aquaculture, which contribute 82 per cent of the total gross value of production (see Table 1). The remaining 18 per cent of fisheries account for a small percentage of total emissions.
“Most of those others are small boutique fisheries – inshore, gillnetting or similar – that are likely to have very low carbon impact,” Rob explains.
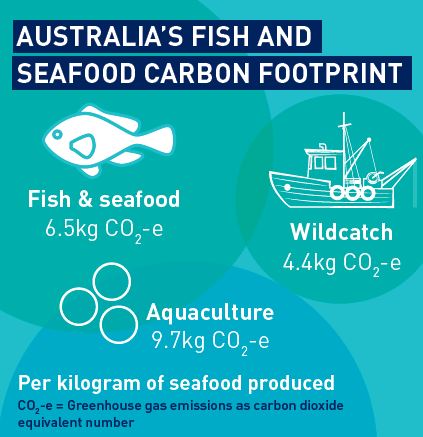
The study estimated the total emissions for Australian fishing and aquaculture to be approximately 1.5 million tonnes CO2-e. This has further been extrapolated to estimate that each kilogram of Australian seafood produced generates 6.5 kilograms CO2-e.
Aquaculture constitutes 59 per cent of the Australian seafood industry’s total emissions and fishing contributes 41 per cent. GHG emissions from aquaculture averaged 9.7 kilograms CO2-e per kilogram of seafood produced compared to 4.4 kilograms CO2-e per kilogram from wild-caught seafood.
The farmed Salmonids sector – Atlantic Salmon (Salmo salar) – predominantly produces the most seafood and also accounts for the greatest proportion of seafood-related emissions, at 37 per cent.
Farmed Southern Bluefin Tuna (Thunnus maccoyii) has the highest intensity of GHG emissions, at nearly 18 kilograms CO2-e per kilogram of seafood produced. This comes from a combination of the fuel used to catch the juvenile fish, greenhouse gas-intensive feed inputs and high transport costs to deliver products to distant export markets.
“For our big fishing fleets, the majority of the emissions come from diesel fuel consumption. There is a little bit associated with freezing and then a little bit associated with transport of the product,” says Rob.
“In land-based aquaculture most direct emissions come from the use of electricity. Emissions embodied in the capture, transport and processing of feed for pond-farmed prawns and fish and coastal cage-grown fish are also major contributors.”
More than half of seafood and aquaculture’s combined GHG emissions (52 per cent) comes from products and services bought from external suppliers, many of which are imported. Rob says this further complicated getting access to required information. The study also found that many of these external emissions (known as ‘Scope 3’) have been left out of Australia’s National Greenhouse Accounts due to the difficulty in accounting for them.
Comparing proteins
There are many different fishing and farming techniques used in seafood production. This makes it difficult to provide direct ‘like-for-like’ comparisons with the greenhouse gas emissions for other proteins. The CSIRO report, Carbon footprint for Australian agricultural products and downstream food products in the supermarket, provides some indicative comparisons.
Table 2: Australian farmed animal proteins – whole of life CO2-e emissions per kilogram of meat on supermarket shelves
|
Beef, fresh boned |
Lamb, fresh boned |
Pork, fresh boned |
Chicken, fresh boned |
|
25.2 |
19.4 |
6.3 |
2.9 |
Source: CSIRO
Energy initiatives
When fishers and aquaculture operators understand how their businesses create emissions, they can make appropriate changes to reduce both emissions and energy costs.
This may include using alternative fuels, driving vehicles or vessels to conserve fuel or changing suppliers. Relevant FRDC research includes trawl net modifications that reduce drag and therefore fuel use, and investigations into alternative fuel sources. Northern Territory Barramundi (Lates calcarifer) producer Humpty Doo is building a solar plant that will power its operations and drastically reduce its emissions. Austral Fisheries, known as an industry leader for innovation and sustainability, has acquired several hybrid fishing vessels that use electricity as well as diesel, giving greater control over its energy costs and emissions.
A way forward
Blueshift Consulting has developed a ‘toolbox’ of resources to help smaller operators begin their own journey by measuring and managing emissions,
“It includes things as simple as asking your suppliers what their greenhouse inputs are,” Rob says. “It provides a series of examples of how other companies go about measuring, managing and marketing their emissions.”
A new self-assessment tool will help operators convert their costs into a carbon number. They can then track their operations year by year and compare themselves within their sector or to other sectors.
“Seafood consumers are increasingly wanting to know the stories behind the products they’re buying, including efforts by fishers and farmers to reduce their carbon footprint. So this process may also help with marketing.”
Three GHG emissions self-assessment tools will soon be available for download from the Blueshift Consulting website, under the ‘Projects’ tab, blueshiftconsulting.com.au/projects f
More information
Rob Bell - rob@blueshiftconsulting.com.au